If you teach grades 4–8, here’s a fun experiment you can run in your classroom tomorrow. No materials required, and in about two minutes, it will tell you whether your students know how to read science diagrams.
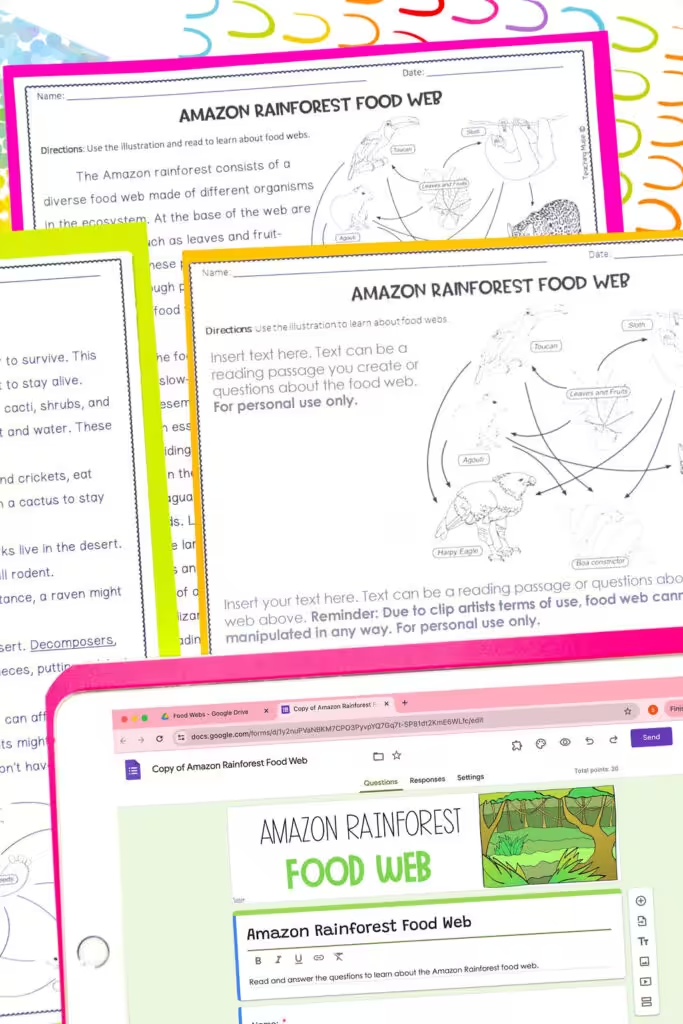
Hand your students a page with a short reading and a beautiful, labeled diagram of the water cycle right next to it. Ask a question that can only be answered using the diagram. Then watch.
They’ll read the paragraph. Twice. They’ll scan it for bold words. They’ll raise their hands and tell you the answer isn’t there. Oh, that gorgeous diagram, the one the publisher probably paid an illustrator real money for, will sit there completely untouched, like the salad at a pizza party.
I’ve been teaching for well over a decade, and I can count on one hand the number of students who walked into my room already knowing how to read a diagram. Most of them treat it like decoration. It’s the picture you look at for half a second before getting back to the “real” reading.
But diagrams are real reading. In science, they’re often where the most important information lives. The good news is that reading them is a skill we can teach, without adding a single new unit to your already overstuffed calendar. Let’s learn how to teach students to actually read a science diagram.
Why Students Skip Right Past Science Diagrams
We like to tell ourselves that kids today are “visual learners.” They grew up on screens. They can navigate a video game map with their eyes closed. Surely a diagram of a plant cell won’t stump them.
It stumps them.
Researchers have actually studied this. A project funded by the National Science Foundation created entire workbooks just to teach high school students how to read the diagrams in their biology textbooks. If teenagers need that much help, it’s no surprise our 10-year-olds do. It matches what I see every single year. Here’s why I think it happens:
- Nobody taught them how. We teach text features in ELA, but diagrams in science come with their own rules. Arrows, keys, cutaways, and scale all mean something, and students are guessing.
- They’ve been trained to hunt for answers in sentences. Years of “find it and underline it” have taught them that the answer lives in a paragraph. So that’s where they look.
- Diagrams look finished. A diagram seems self-explanatory to us because we already understand the concept. To a 10-year-old, it can look like a lot of boxes and arrows going nowhere in particular.
- We let them skip it. Guilty as charged. If our questions never require the diagram, why would they bother?
That last one is the easiest to fix. So let’s fix it.
1. Teach the Conventions (Yes, Arrows Need a Lesson)
Ask a room of fifth graders what an arrow means in a diagram, and you’ll get a confident answer. Then ask what the arrow means in a different diagram, and you’ll get the same answer. That’s the problem.
In a food web, an arrow shows where energy goes. In the water cycle, it shows movement. In a life cycle, it shows the next stage. In a force diagram, it shows direction and strength. Same symbol, four different jobs. No wonder kids are confused. I’m a little confused just typing it.
Before students can read diagrams, they need to know the parts. I spend a few minutes early in the year walking through:
- The title: What is this diagram even about?
- Labels: What are the parts called?
- Arrows: What is moving, changing, or coming next?
- Keys and colors: What does each color or symbol stand for?
- Captions: What extra information is hiding in that tiny print underneath?
- Scale: Is this actual size, zoomed in, or zoomed way out?
Then I build a quick habit. Every time we meet a new diagram, students tell me what the arrows mean in this one before we do anything else. It takes 30 seconds, and it saves me about 30 minutes of untangling misconceptions later.
If this sounds familiar, it’s the same idea as having students read the axes before they touch a graph. I wrote more about that routine in From “I Hate Graphs” to “I Can Do This”.
2. Make Them Go Back and Forth Between the Text and the Diagram
Here’s the sneaky truth about diagrams and readings: they’re usually not saying the same thing. The text explains why. The diagram shows where or how. Students need both, and they need to practice connecting them.
The easiest way to make that happen is to write questions that can’t be answered from just one source. A few I use all the time:
- “What does the diagram show that the text doesn’t?”
- “Find the sentence in the reading that describes this part of the diagram.”
- “The text mentions evaporation. Point to where it happens on the diagram.”
- “Use the reading AND the diagram to explain what happens to the energy.”
That last one is my favorite, mostly because of the groans. When students realize they can’t get away with skimming one source, they slow down. Slowing down is the whole point.
If you want a quick visual reminder, have students draw a little arrow in the margin connecting a sentence to the part of the diagram it describes. It’s simple, it’s fast, and it makes their thinking visible.
3. Have Students Talk You Through It
You know how you don’t really understand something until you have to teach it? Kids are the same; they just complain about it more.
One of my go-to moves is the “tour guide.” A student picks a starting point on the diagram and walks me through it out loud: “First the water evaporates from the ocean. Then it rises and cools, and that makes clouds…” Their partner’s job is to follow along with a finger and stop them if something doesn’t match the diagram.
This does two things. First, it forces students to actually look at every part instead of the one label they recognize. Second, it shows me exactly where their understanding breaks down. When a student confidently announces that the arrow means the sun is “pushing” the water up, I know what we’re reviewing tomorrow.
A few prompts that keep the tour on track:
- “Start here. What happens first?”
- “How does this part connect to that part?”
- “What would happen if this part of the system stopped working?”
- “Which part of the diagram would you show someone who missed class?”
No writing required, so it works as a quick warm-up or an exit ticket. And honestly, it’s a lot more fun to grade a conversation than a stack of worksheets.
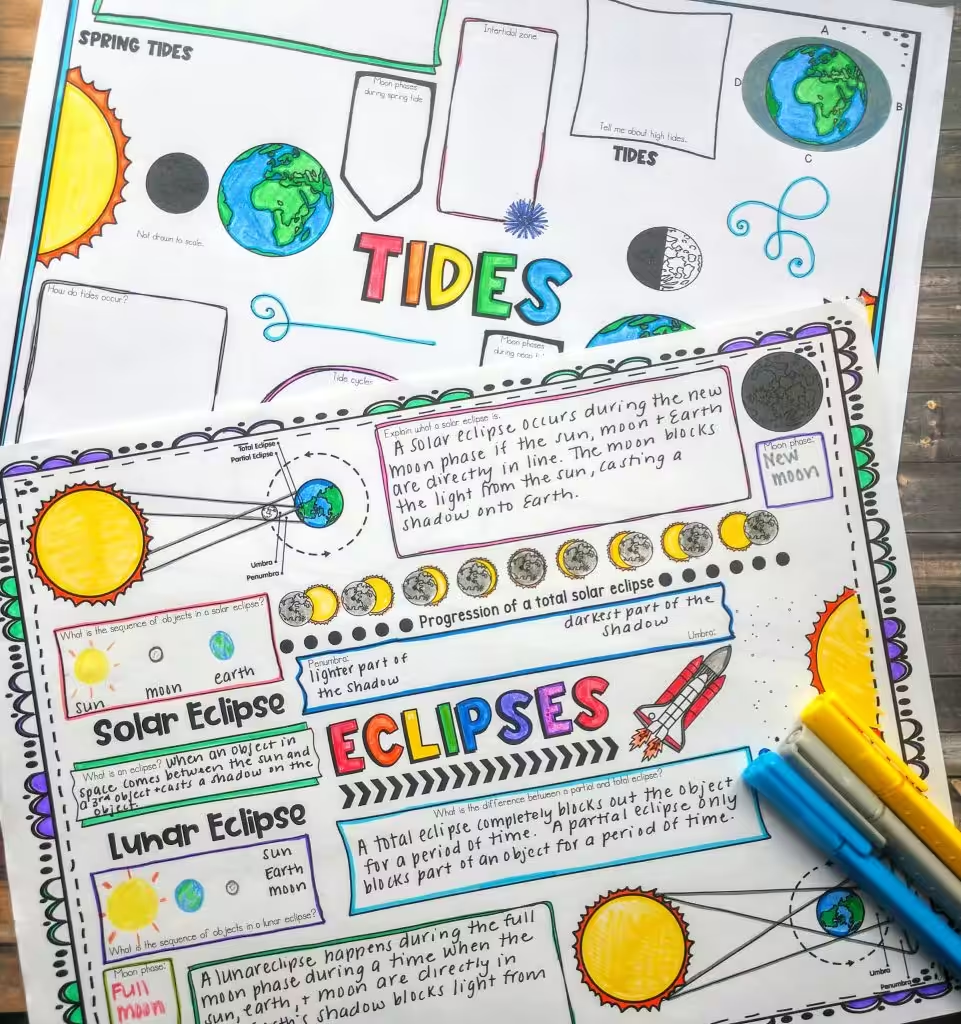
Once they can talk it through, have them put it in writing. A diagram makes excellent evidence in a Claim, Evidence, and Reasoning response, and it’s a great way to show students that evidence doesn’t only come from sentences.
Want an easy way to start? Grab my free CER Graphic Organizer and Writing Formula to help students turn diagram evidence into strong written responses.
4. Hand Them a Diagram With Pieces Missing
If you’ve ever handed out a fully labeled diagram and asked students to “study it,” you know how that goes. Eyes glaze. Someone asks to get water. Nothing happens.
Now hand them the same diagram with a few labels or arrows missing. Suddenly it’s a puzzle, and kids love a puzzle. They’ll stare at that thing like it owes them money.
A few ways to set it up:
- Blank out labels. Students fill them in using the reading or their notes.
- Remove arrows. Students draw them in and explain which direction they go and why.
- Cut out one stage. Leave a gap in a cycle or process and ask what belongs there.
- Add a mistake. Put one arrow going the wrong way and challenge students to find it. This one is my personal favorite. Nothing motivates a middle schooler like the chance to prove the teacher wrong.
That same project I mentioned earlier built whole workbooks around this idea, having high school students fill in the missing parts of diagrams. It works because students have to understand how the parts fit together, not just memorize where the words go.
Food webs are perfect for this. Remove a few arrows and ask students to rebuild the flow of energy. My ecosystems and food web activities give students plenty of practice reading and interpreting these relationships.
5. Let Them Draw Their Own
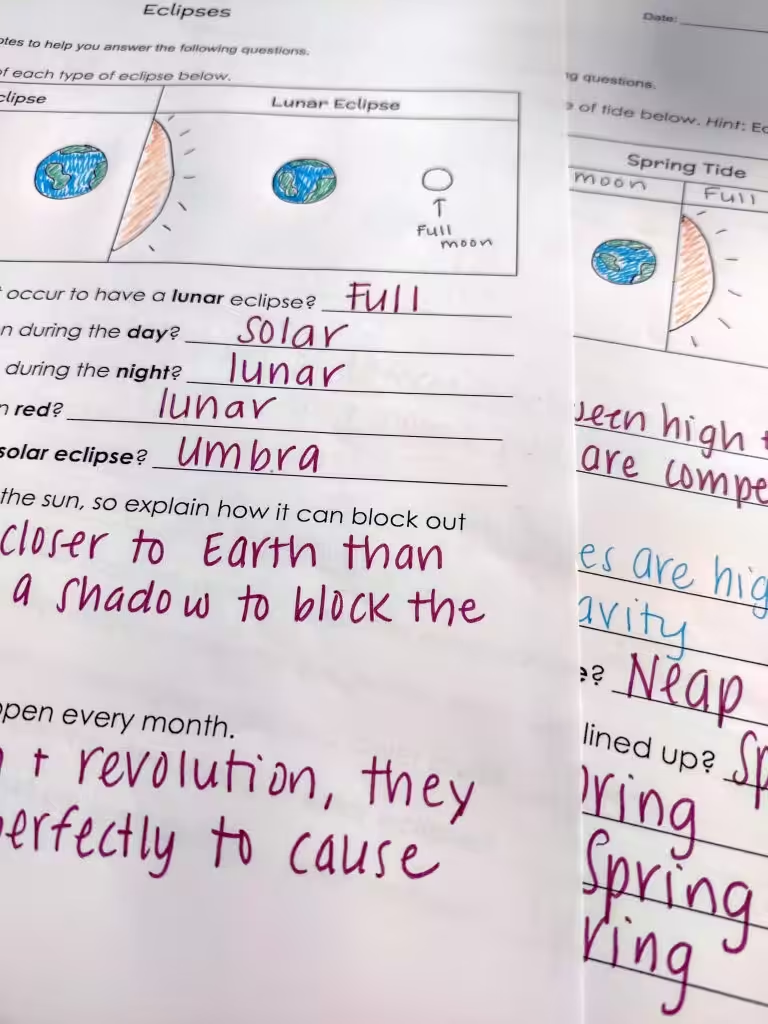
Once students can read a diagram, the next step is making one. This is where the real understanding shows up, and where you’ll find out who was nodding along without a clue.
I’m not talking about a beautiful, color-coded masterpiece. I’ve seen enough glitter in my teaching career to last a lifetime. A quick sketch in a science notebook is plenty. What matters is that students decide what to include, how the parts connect, and what the arrows mean.
Some easy ways to work this in:
- After a lab: “Draw a model that shows what happened and why.”
- After a reading: “Turn this paragraph into a diagram with at least three labels and two arrows.”
- Before a unit: “Draw what you think happens when…” Save these. Comparing them to an end-of-unit drawing is incredibly satisfying.
- Swap and critique: Students trade models and figure out what their partner’s arrows mean without asking. If they can’t tell, the diagram needs work.
This also covers one of the NGSS science and engineering practices, Developing and Using Models. So if an administrator wanders in while your class is drawing, you are not “just doing art.” You are aligned to standards. Say it with confidence.
Stop Letting the Diagram Be the Salad
Diagrams aren’t decoration, and whether you teach upper elementary or middle school, your students won’t figure that out on their own. The good news is you don’t need a new unit to teach it. You need a few habits:
- Name what the arrows mean before anything else.
- Ask questions that require both the text and the diagram.
- Have students talk you through it.
- Take pieces away and let them rebuild it.
- Have them draw their own.
Start with just one. Pick the next diagram in your unit, ask one question that can only be answered by looking at it, and see what happens. I’m guessing you’ll get a few groans. That’s how you know it’s working.
For more ways to build literacy into science without turning your class into a second ELA block, check out 5 Simple Ways to Build Reading and Literacy Skills in Science.
If you want ready-to-go practice, my literacy-infused science passages pair readings with diagrams and questions that make students actually use both. Your diagrams deserve better than being ignored.